Unix top command helps you find out most of the system-related stuff which a Unix user needs to know about the system.
Top command in Unix helps you to diagnose any system related issue and you can correct the configuration if needed based on the results.
The top program provides a dynamic real-time view of the running system. It displays system summary information as well as a list of tasks currently being managed by the Linux kernel.
Different System summary information is shown and all the information displayed for the tasks are user-configurable and that configuration can be saved and retained across restarts.
In short, you can see the results of all the system related commands like “free, ps, vmstat, who, w and uptime” just by typing one command, i.e. top.
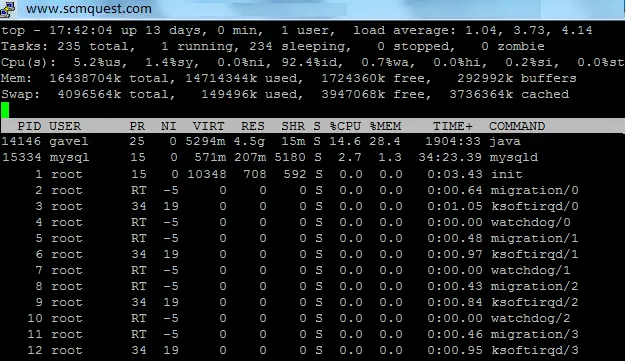
Type “top” command on your Unix/Linux console and it will display all the system’s information like CPU, memory, swap, running tasks of each process–all in a single view.
Press ‘q‘ to quit/return.
When you start top for the first time, you be presented with the traditional screen elements:
- Summary Area
- Message/Prompt Line
- Columns Header
- Task Area
To understand the top command output, let’s go line by line.
The first line shows:
Current System Time along with the information since when the system is UP and running.
Number of Users who logged in currently to the system.
Load Average on the System at default 1, 5 and 15 minutes intervals.
The second line shows Process statistics in below format:
Number of Tasks currently assigned to the system
Running: Tasks that are currently running on the system.
Sleeping: Tasks that are not active, processes that are blocked as they are waiting for an event e.g. sleep(), time out or I/O completion.
Stopped: It simply means that the process is “paused,” but not “terminated.” The most common source of STOP signals is the user hitting ^z while the process is in the foreground. A stopped process will not terminate due to a TERM signal until it is continued. It will terminate as soon as it receives a KILL signal even the process is stopped.
Zombie: A zombie process is a finished/died process, it isn’t all removed from memory immediately but it has still occupied an entry in the process table. Usually, a child process that has finished its execution sends a SIGCHLD signal to the parent process which has created it.
Then the parent process sends a wait() system call through which it can read the child’s exit status. After receiving the wait system call, the child’s entry will get removed from the process table.
But in some cases, the parent process may ignore the SIGCHLD signal which actually causes the completed process to still exist in the process table and that makes it a zombie process.
Sometimes this is desirable for the parent process to ensure that it doesn’t allocate the same PID to another child. When a process becomes dead, it just frees up the memory and other resources allocated to it, which means a zombie process will not be using any resources at all, other than an entry in the process table.
However, if zombies are created at a high rate, the entire available PIDs pool will get filled with zombie processes that will prevent other processes from launching.
The third line shows CPU information in below format:
us: Percentage (%) of CPU time spent in user mode
sy: Percentage (%) of CPU time spent in kernel mode
Basically, there are two modes, user and kernel mode, %us represents the percentage of time spent on user processes, but when those processes acquire Kernel layer for some tasks such as reading or writing to the hard disk or allocating several kilobytes of RAM then it known as system calls.
ni: Percentage (%) of CPU time spent on low priority processes
id: Percentage (%) of CPU time spent idle
wa: Percentage (%) of CPU time spent in wait (on disk)
hi: Percentage (%) of CPU time spent servicing/handling hardware interrupts (hardware irq)
si: Percentage (%) of CPU time spent servicing/handling software interrupts (software irq)
st: Percentage (%) of CPU time in involuntary wait by virtual CPU while hypervisor is servicing another processor (or) % CPU time stolen from a virtual machine
hi represents the time spent processing hardware interrupts. Hardware interrupts are generated by hardware devices when they need to send a signal to the CPU.
Whenever long or complex processing is required, these tasks are deferred using a mechanism call softirqs. These are scheduled independently, can run on any CPU, can even run concurrently. Softirqs are statically allocated at compile-time
si represents the time spent in these softirqs.
The next two lines show memory details.
The fourth line shows Physical Memory information and the fifth line shows Swap Memory information.
Both lines provide you a snapshot of memory being used by various processes.
Mem represents the actual memory (RAM) that is mappable by your Unix/Linux kernel. It is not just used for user-related data but for kernel data as well. Kernal permanently reserves a small chunk of memory for itself to use at startup which is hidden to the user.
Swap is used when the amount of physical memory (RAM) is full, when the RAM gets full and the system needs more memory resources, the kernel moves the inactive pages in memory to the swap space. Swap space is created on hard drives, which have a slower access time compared to physical memory.
Following terms are used for both Physical and Swap memories:
Total: Total Memory available in your system
Used: Memory which is being consumed by the system
Free: Free Memory for the system.
where Memory denotes Physical Or Swap memory respectively.
The below terms are a little mystifying, someone takes the wrong assumption that Cache is only for Swap memory because it’s placed inside the Swap line.
Actually, the simple logic for memory is:
Total = Used + Free
Used = buffers+cached
Buffers: It is the size of in-memory block I/O buffers, they relatively exist for a short span of time. When a kernel accesses the disk to access a file or block the device it increases the buffer size.
Cached: Cached is the size of the Linux page cache, excluding the memory in the swap cache, which is represented by SwapCached (hence the total page cache size is Cached + SwapCached). The cached represents the size of RAM used to cache the content of files being read recently.
For example, whenever you perform the read operation of a file on disk, the data gets loaded and read into memory, then it goes into the page cache.
Once the read operation completes, the kernel will remain with 2 options. The first is just simply throwing the page away since it is not being used and the second is to cache it for future operations.
So when you do another read of the same area in a file, the data will be read directly out of memory and no trip to the disk will be taken as it’s being loaded from the page cache.
How Cached is different from Buffers?
Buffers size increases when the system accesses the page whereas Cached size increase when the system accessed the page and goes back.
Reading a file from Cache is relatively fast compared to a fresh start.
Now coming to the Processes Statistics.
“top” provides you below details for the processes:
PID: Process ID of the process, every process has a unique process ID.
USER: It’s a user name for the owner of each process.
PR: The priority of the task, RT denotes a Real-Time priority class that is used for system processes. PR is the actual priority of the process as viewed by the Linux kernel.
Kernel simply sets the priority +20 from the nice value for normal processes, which means the highest priority nice value receives a kernel priority of 0.
Sometimes you may see the difference in nice value and PR as the process scheduler applies a small gratuity or penalty to interactive or processor-hogging tasks as the kernel can dynamically change the user PR depending on how interactive the process is.
NI: The nice value of the task. A negative nice value means higher priority, whereas a positive nice value means lower priority. Every new process has a nice level 0, but you can override it with the “nice” utility. NI ranges from -20 to 19.
VIRT: VERT is the amount of virtual memory used by a process. It refers to the length of the memory area. It includes all code, data and shared libraries plus pages that have been swapped out.
VIRT represents how much memory the program is able to access at the present moment and it doesn’t mean that this process actually uses that amount of memory. It’s a combination of both Physical and Swap memory allocated to the process.
RES: RES is a resident size, which represents non-swapped physical memory a task is using, It tells you how many memory blocks (known as pages) are really allocated and mapped to process address space. Undoubtedly this will virtually always be less than the VIRT size.
SHR: The amount of shared memory used by a task. It simply reflects memory that could be potentially shared with other processes. SHR indicates how much of the VIRT size is actually sharable (memory or libraries).
The actual memory consumption of a process can be calculated RES minus SHR depending on how many shared libraries are used by any given process and other processes using those same libraries.
S: Represents Process Status
The status of the task can be one of:
‘D’ = uninterpretable sleep
‘R’ = running
‘S’ = sleeping
‘T’ = traced or stopped
‘Z’ = zombie
** Tasks shown as running should be more properly thought of as ‘ready to run’ — their task_struct is simply represented on the Linux run queue. Even without a true SMP machine, you may see numerous tasks in this state depending on the top’s delay interval and nice value.
%CPU: Represents the percentage of the timeshares CPU spends running the process. By default, top output is sorted with CPU usage.
%MEM: Represents the percentage of the physical memory of the system which is used by the process.
Please refer above explanations for CPU and MEM stats.
TIME+: total time CPU(s) spent running the process.
COMMAND: command used to initiate the process.
Unix Top Command Examples (With Shortcuts)
You can use the below shortcuts to use the “top” command more efficiently.
Set ‘Screen Refresh Interval’ [delay in top output] in Top
d or s –To change the time interval for updating top results (value is in sec’s)
Show/Hide lines
If you don’t want to see all information, you can hide the information by using the below shortcuts:
- l –To display or to hide load average line
- t –To display or to hide task/cpu line
- m –To display or to hide RAM and SWAP details
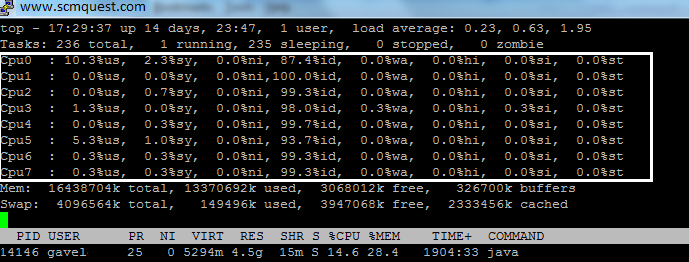
- 1 –– To display or hide all other CPU’s, like
Display Specific User Process
You can run the top command with option -u to show the user-specific processes only or you could use the shortcut in the “top” window.
top -u root
u — Press u then username to get only that user process details
Sorting the output
By default, the top output is sorted with CPU usage. You can change the order with the below shortcuts:
- P –To sort by CPU utilization
- M –To sort by RAM utilization
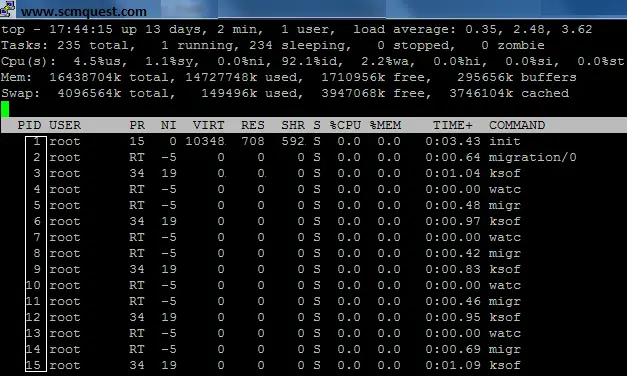
- R –To sort by PID number, like
Kill running process
k –To kill a process, press k then PID number then enter to kill a process
Highlight Running Process in Top
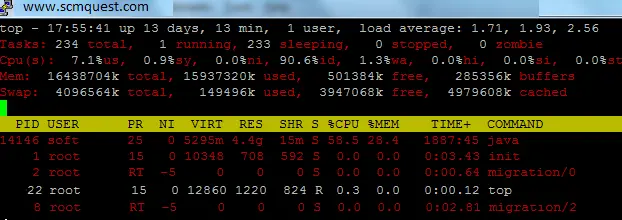
z – press ‘z‘ option to display running process in colour which may help you to identify running process easily.
Renice a Process
r –To renice a process, press r then the PID no then the renice value to renice a process.
Show the absolute path of the processes
c –To display or hide command full path
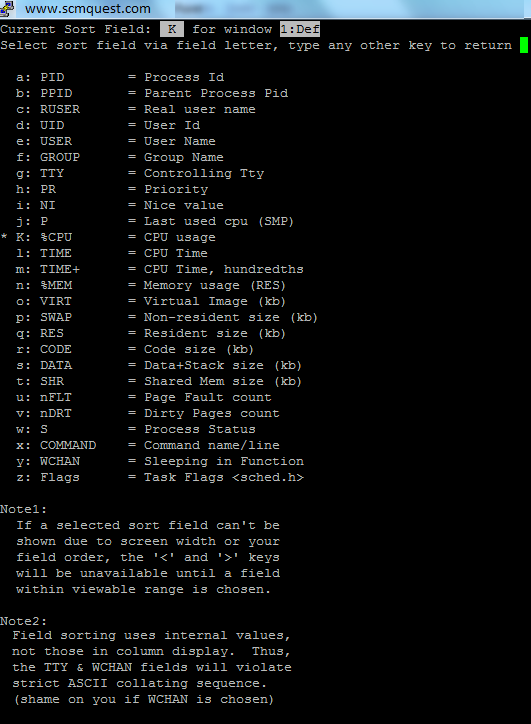
Sorting the top output via field letter
O – Press (Shift+O) to Sort field via field letter, for example, press ‘a‘ letter to sort process with PID (Process ID)
Press ‘W‘ to save your work for next time.
Press ‘q‘ to quit exit the window.
Wrapping Up: Unix Top Command
There you have it!
I hope you liked this detailed guide on the top command in Unix with examples.
Start using this command in your day to day activities to get rid of all process-related issues.
If you have any queries, drop us a comment below.







This is one awesome blog. Grea
Great content… thx a ton !!!
Really a good article. Can you please explain utilization of top command with scenario wise with some examples i.e using it for specific purposes ?
Thanks for the blog article. Great.
Major thanks for the article post.Really looking forward to read more. Really Great.
Thanks-a-mundo for the post. Really thank you! Awesome.